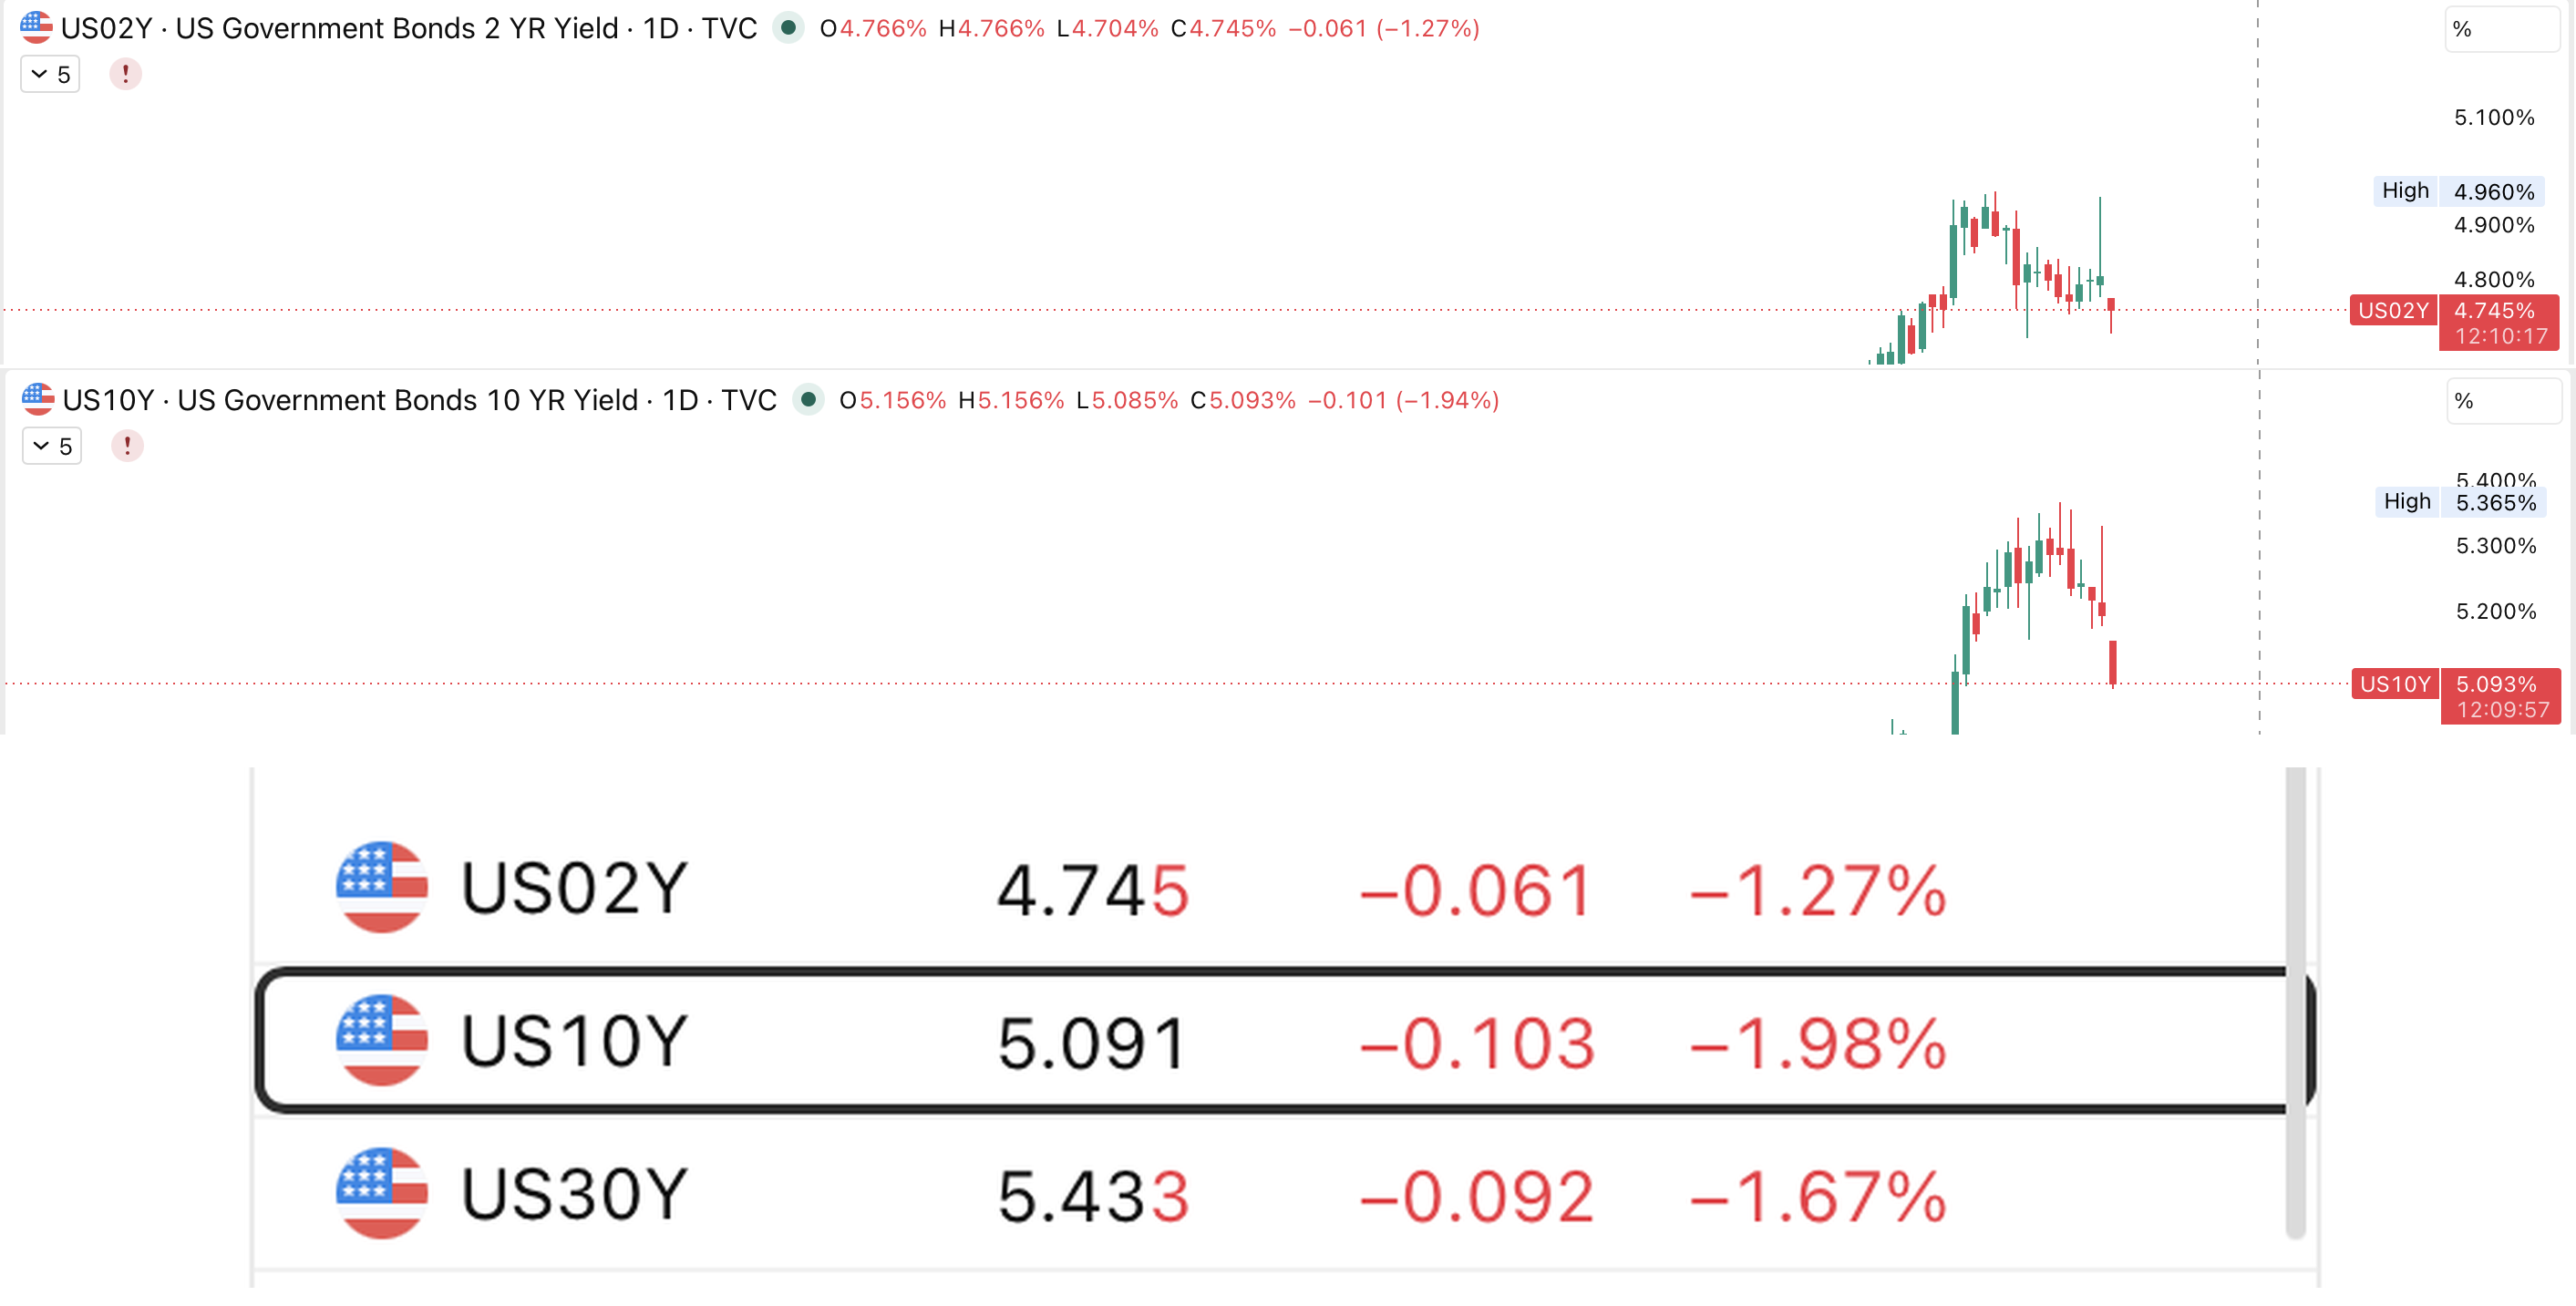
Source: TradingView (TVC) | Data as of October 15, 2026 | Daily candles, 2-year and 10-year US Treasury yields
Hot inflation, falling yields, and why the midterm window may be opening
Wednesday's September CPI report ran a touch above forecasts. Headline inflation came in at 3.7% against 3.6% expected. Core, which leaves out food and energy, came in at 2.6% against 2.5%, and the monthly core reading was 0.3% against 0.2%. Nobody would call it a blowout. But it moved in the wrong direction, and it landed when the market was already worried about a rate hike. Most of the gap between headline and core is energy, with gasoline prices still carrying the weight of the Iran war.
| Actual | Forecast | Previous | |
|---|---|---|---|
| CPI, year over year | 3.7% | 3.6% | 3.4% |
| CPI, month over month | 0.6% | 0.6% | 0.4% |
| Core CPI, year over year | 2.6% | 2.5% | 2.4% |
| Core CPI, month over month | 0.3% | 0.2% | 0.3% |
The usual playbook says a hot print pushes yields up, and for a short while it did. The 2-year yield jumped about 16 basis points when the number hit. A basis point is one hundredth of a percentage point, so that is a move of 0.16. Then it reversed. Today the 2-year sits near 4.75% and the 10-year near 5.09%, both lower on the day and well under their recent highs of 4.96% and 5.365%.
We do not want to oversell this. Part of that move was plain fear. Stocks sold off, volatility rose, some investors ran into Treasuries for shelter, and traders who had bet against bonds had to buy them back. That is not the same thing as relief. But look at what did not happen. Inflation ran hot, the Fed was already leaning toward a hike, and still nobody pushed yields to a new high. The 10-year is more than a quarter of a percentage point below the peak it set recently.
Think of a developer announcing a delay on a Dubai tower. If apartment prices around it do not budge, buyers had already assumed the delay and it was sitting in the price. Markets work the same way. When bad news cannot move the price, the news was already in it. That is the information.
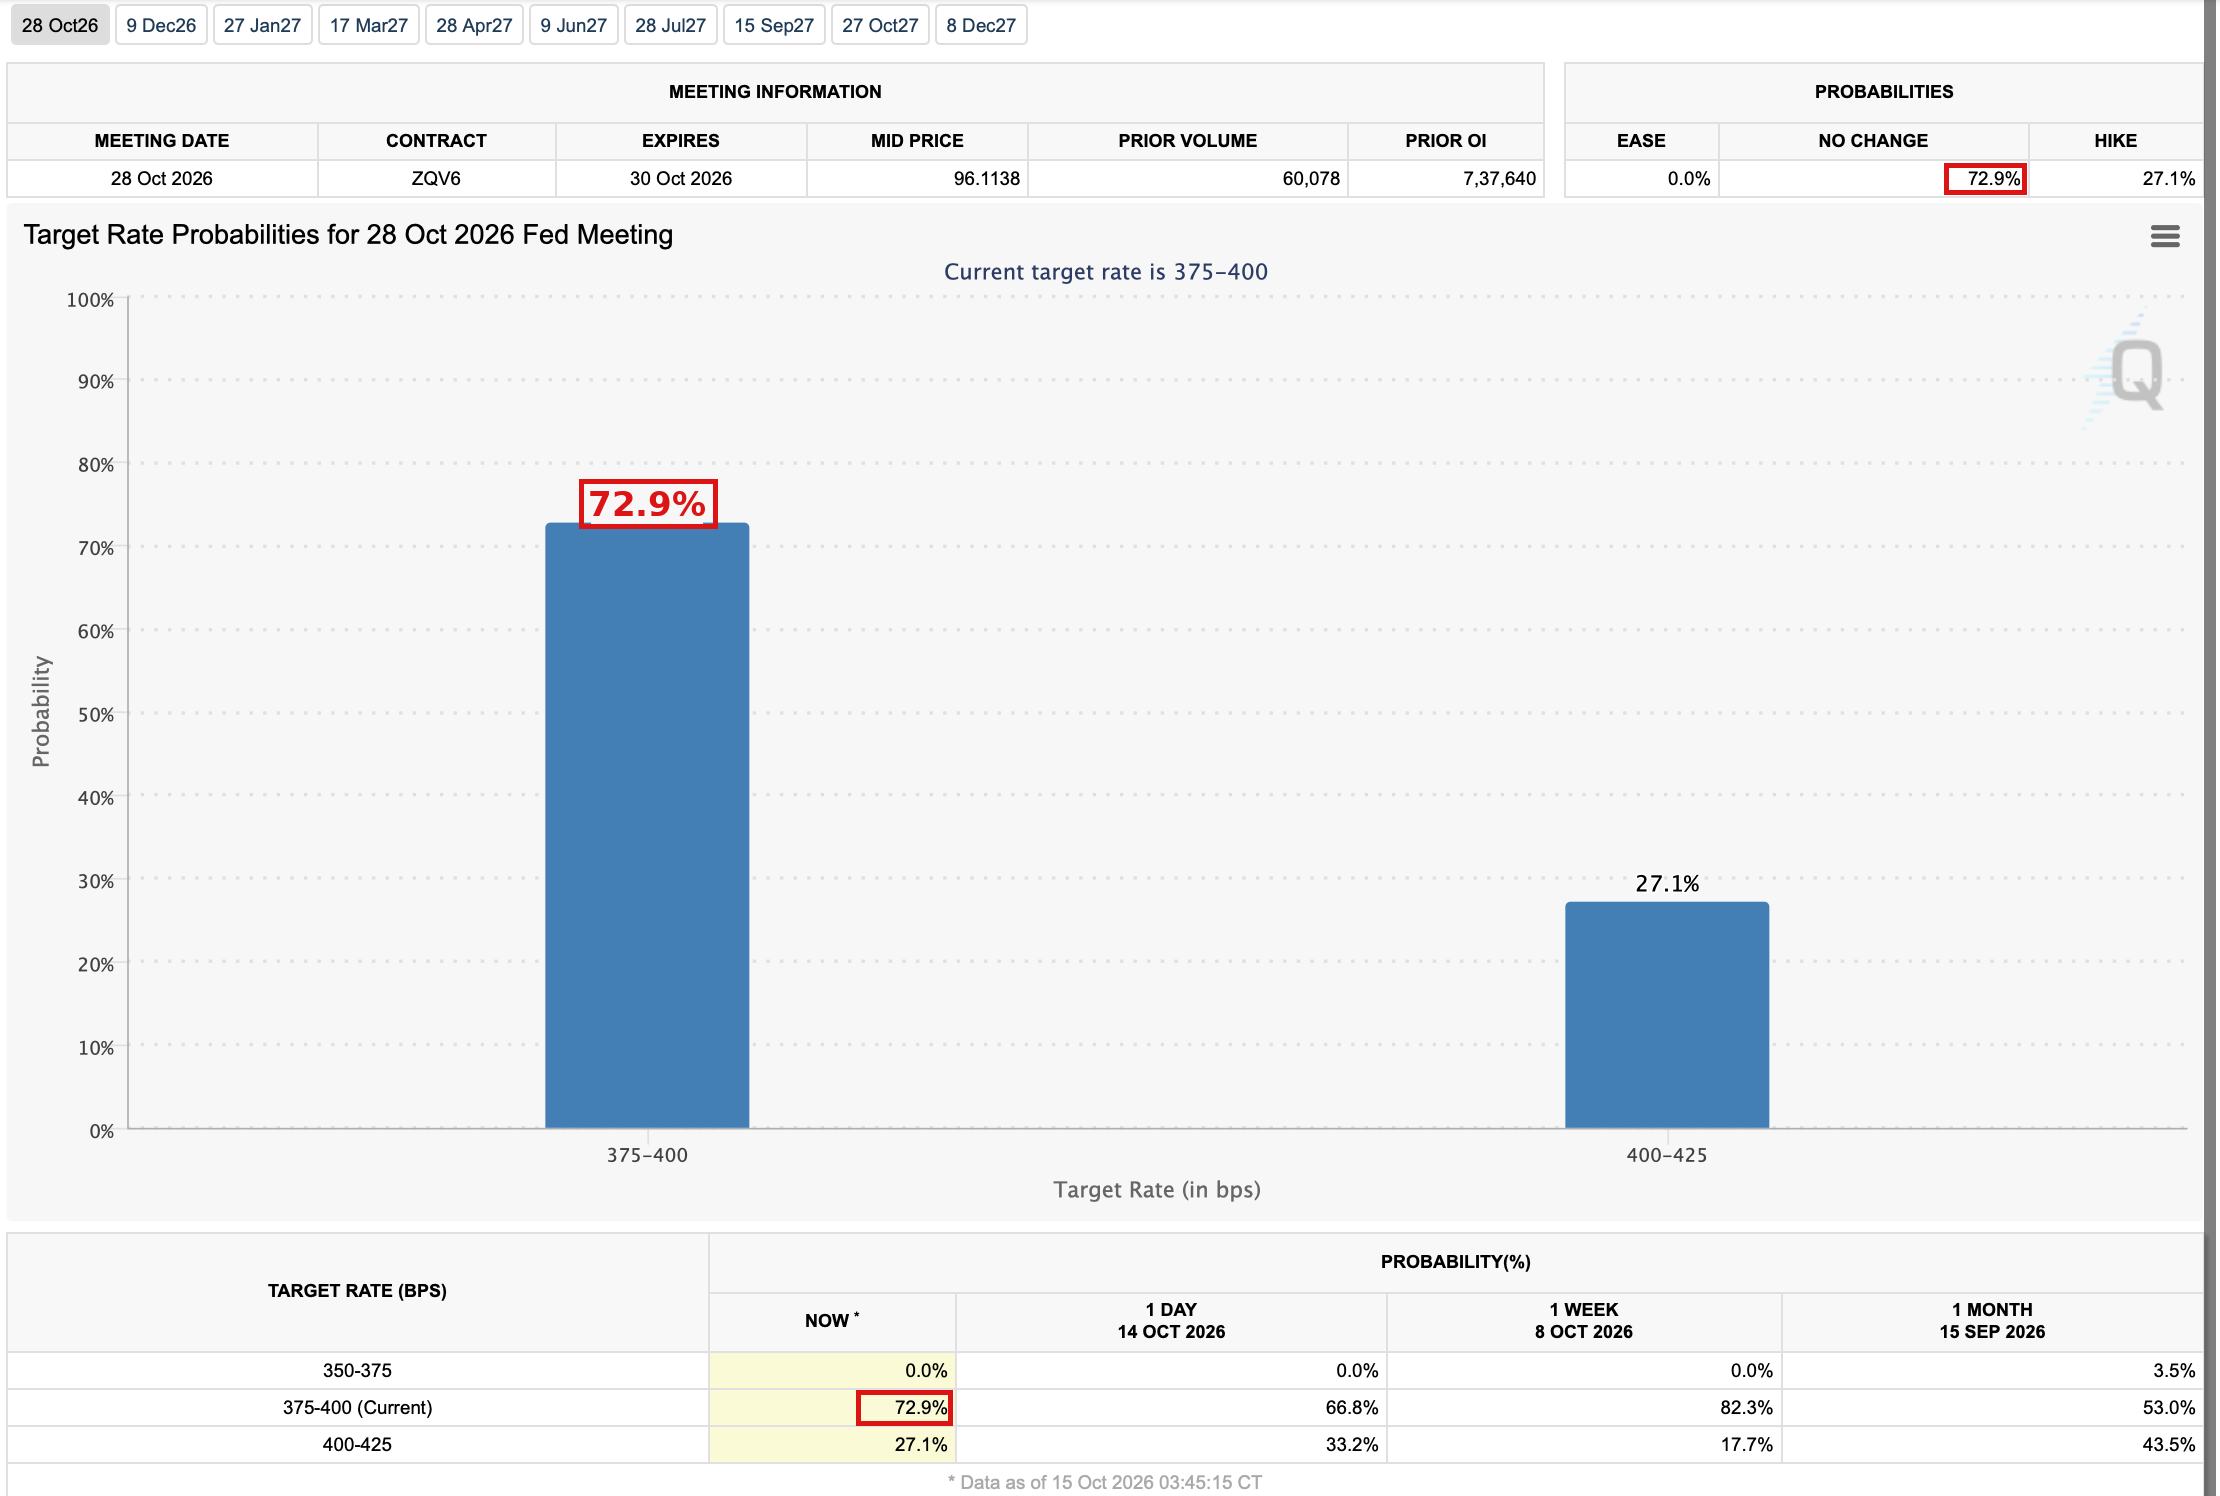
The Fed's target range today is 3.75% to 4.00%. According to the CME FedWatch tool, the chance of no change at the October 28 meeting is 72.9%, and the chance of a hike to 4.00%-4.25% is 27.1%. Watch how quickly that number moved. A week ago the hike was priced at just 17.7%. By the close on CPI day it had jumped to 33.2%. A day later it was back down to 27.1%. Same inflation data, less worry.
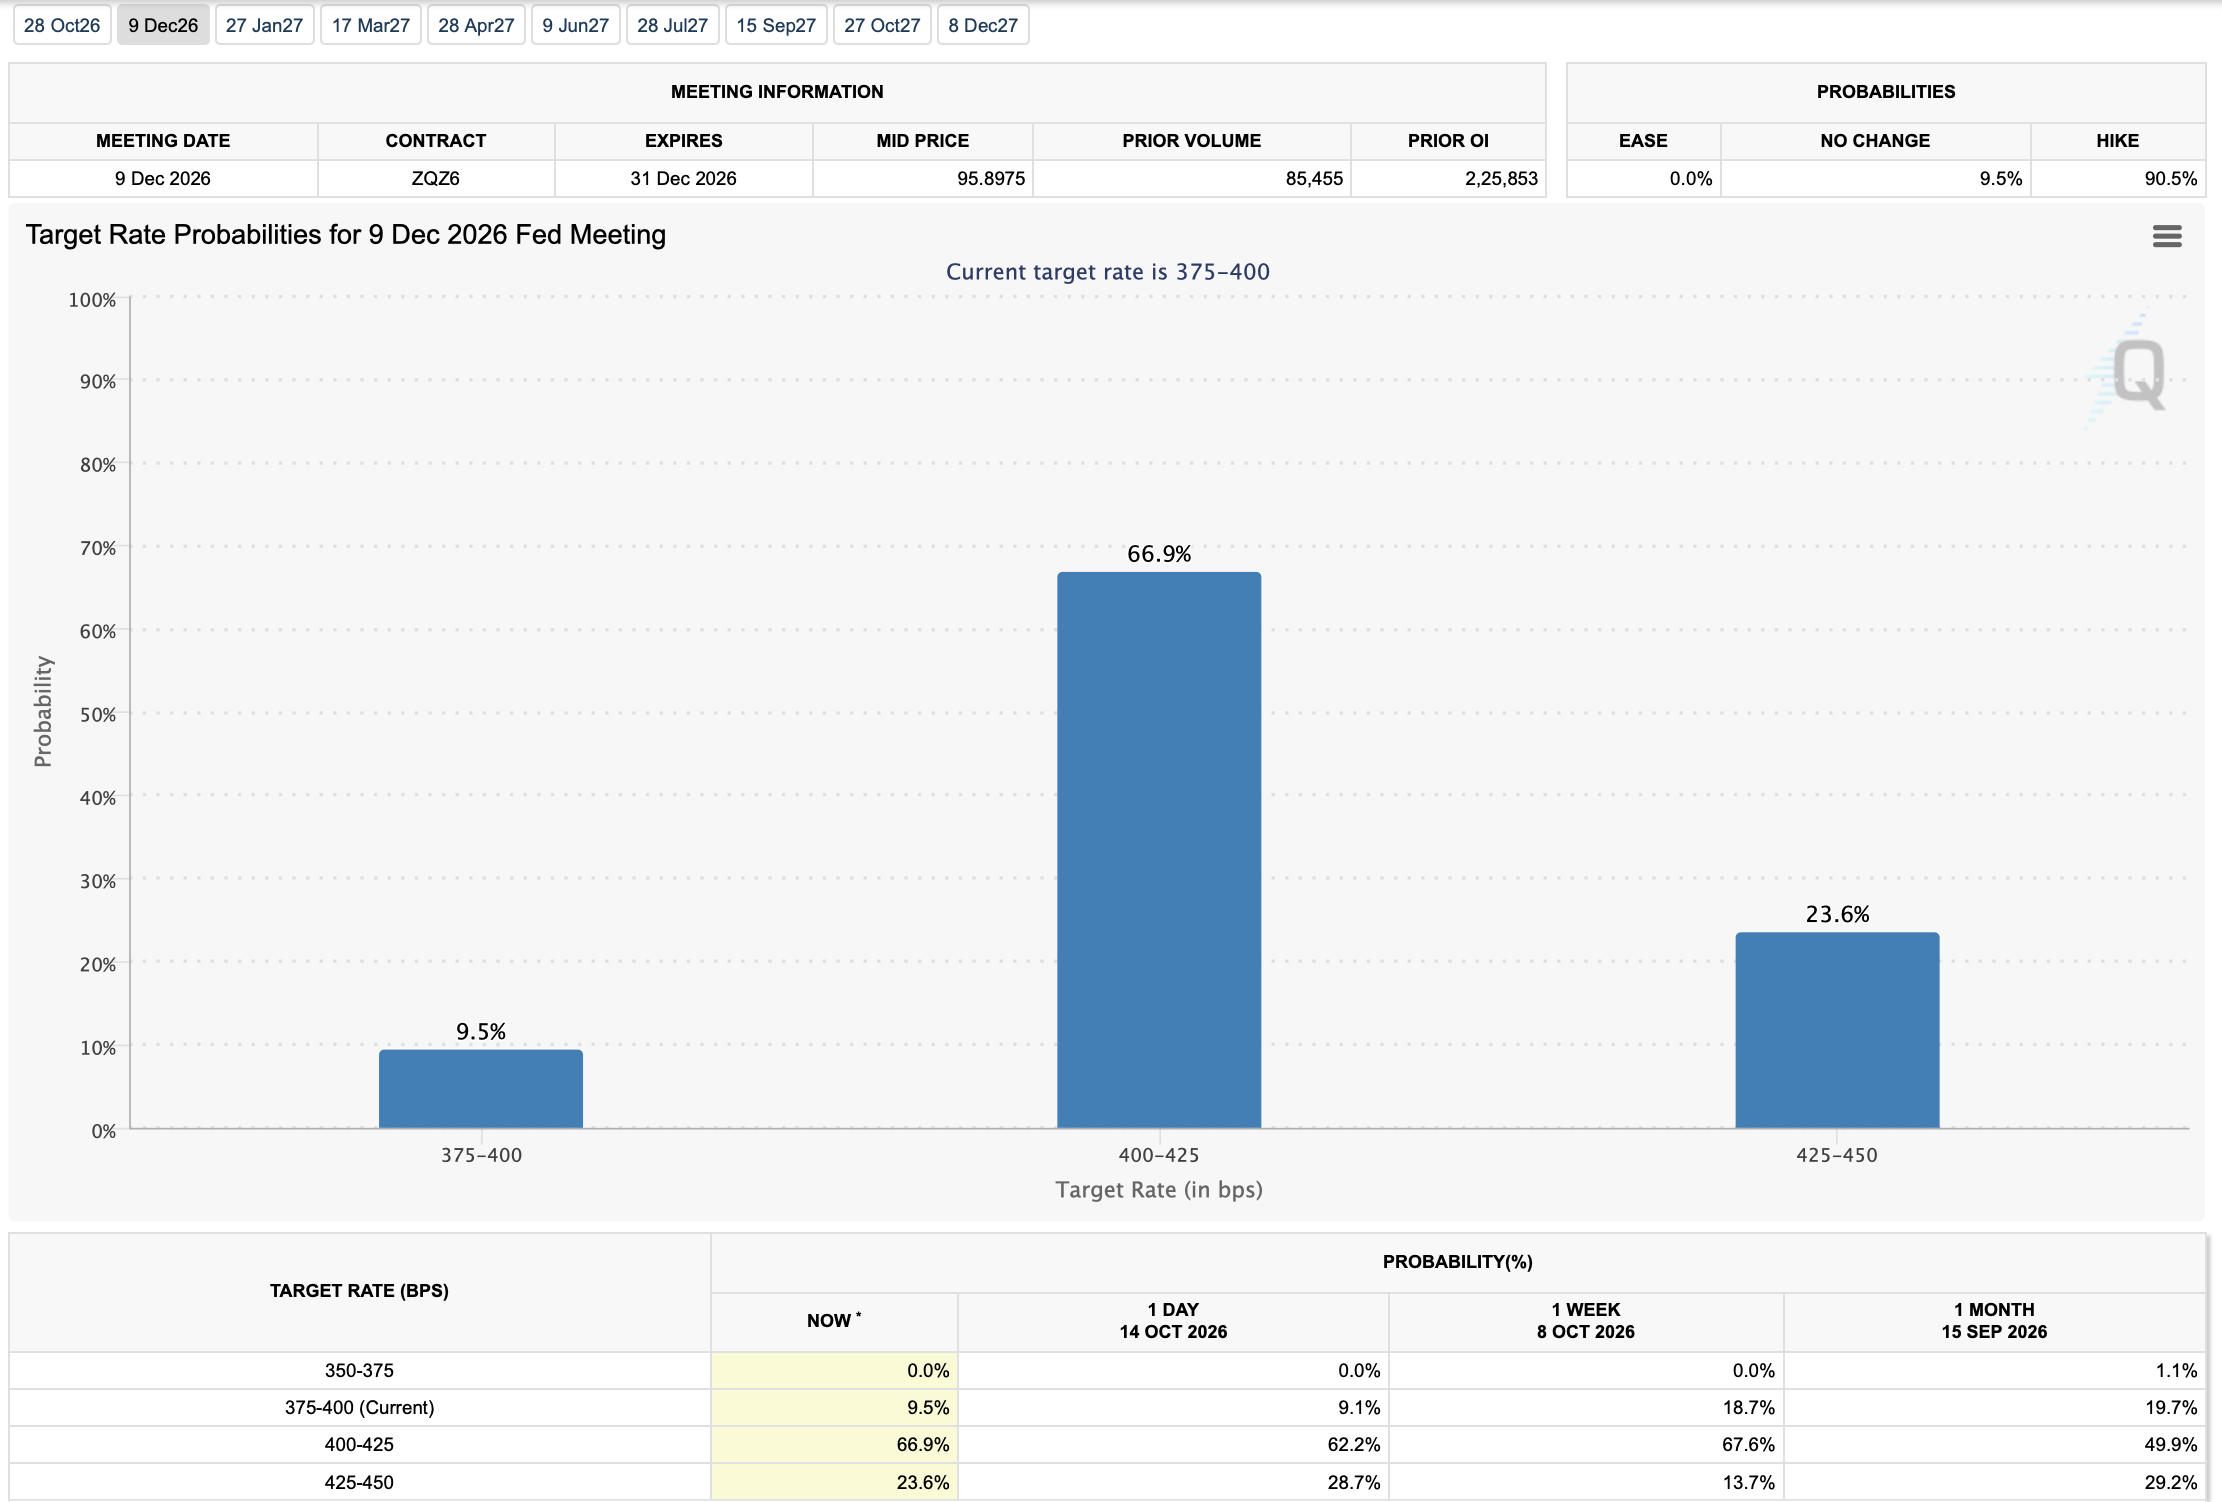
Now look at December, because this is the part people miss. The market gives a hike on December 9 a 90.5% chance. A single hike is priced at 66.9% and two hikes at 23.6%. Over the past month, a December hike has been priced anywhere between roughly 79% and 91%. So the market has not decided the Fed is finished. It has decided the Fed can wait.
That matters for stocks. A Fed that hikes after the midterm election, with more data in hand, is a different animal from one that hikes straight into a CPI shock. It gives equities about six weeks of breathing room before the next decision, and it gives falling yields a chance to do some work.
Wednesday was not kind to equities. The S&P 500 fell 1.11% to 7,718.94 and the Nasdaq fell 1.88%. Technology was the worst sector in the index, down 3.0%, and the Philadelphia Semiconductor Index dropped around 4.5%. Dell lost 8% after a downgrade and CoreWeave fell more than 15% on worries about how the AI buildout gets paid for. The VIX rose about 10% to roughly 16.9, which is a jump but nowhere near panic.
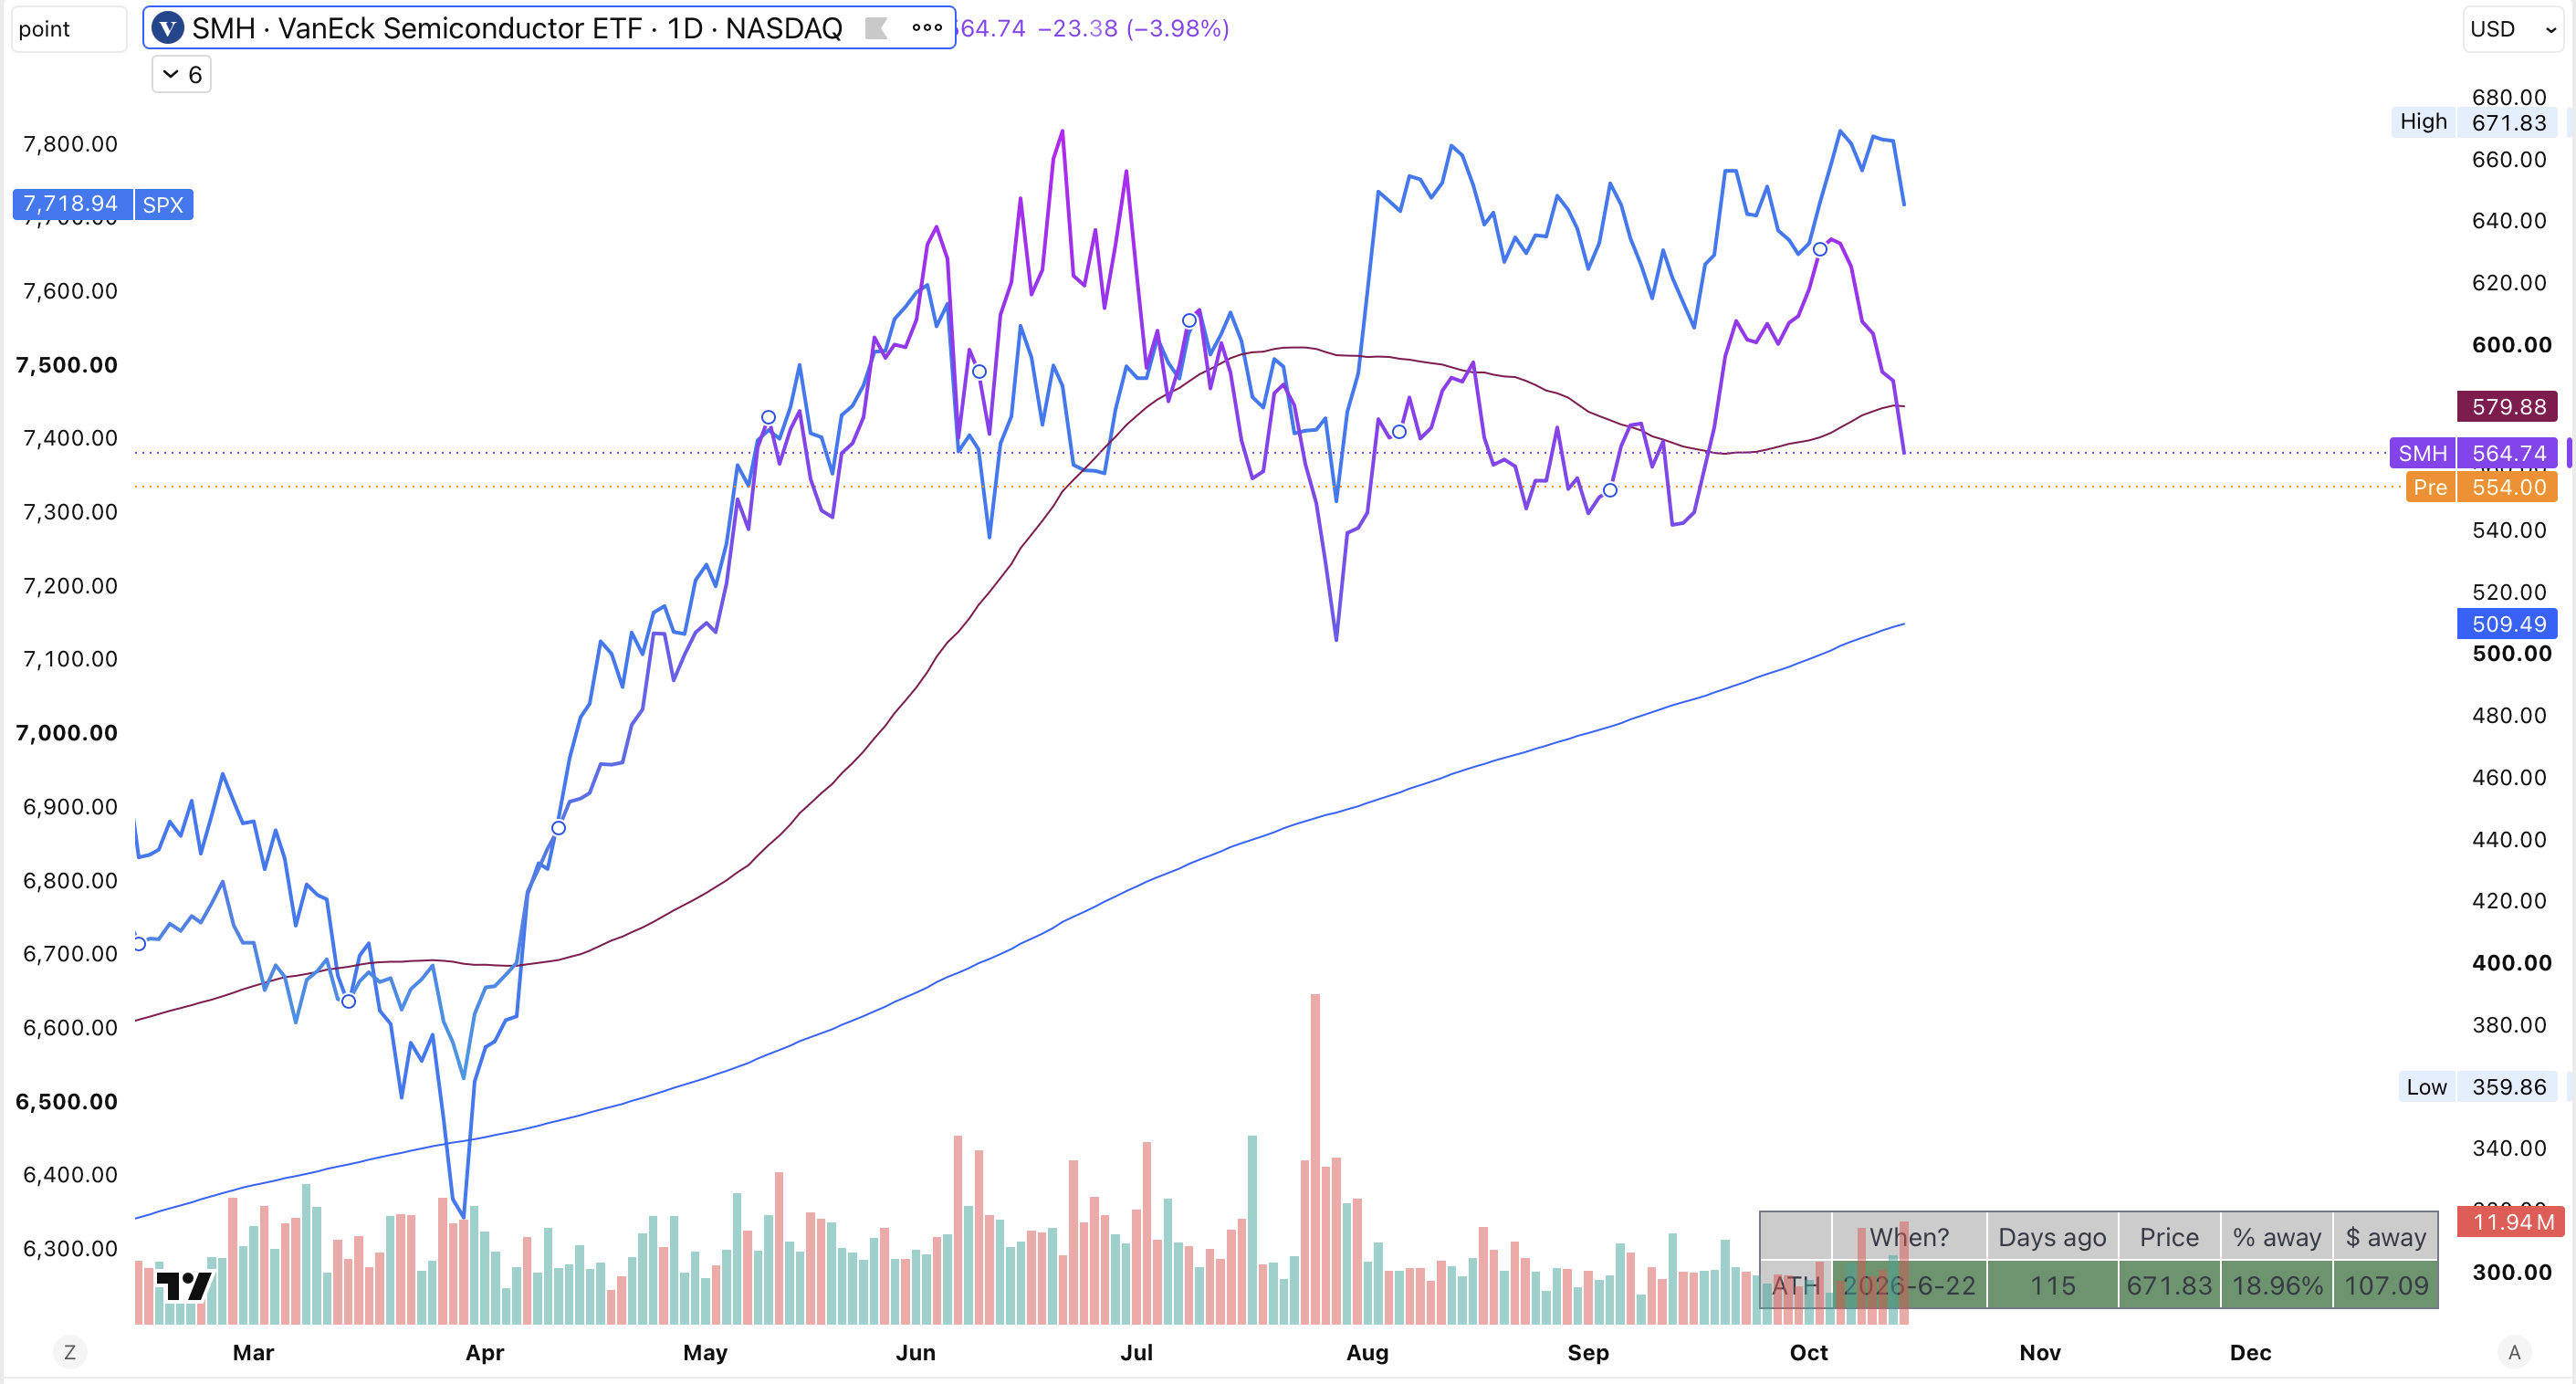
The chart shows what that day did to semiconductors. The VanEck Semiconductor ETF closed at 564.74, about 19% under its June 22 high of 671.83 and below its shorter-term moving average. The S&P 500 sits within about 2% of its own record. So the pullback is concentrated in the leaders, not spread across the market. For the record, the same chart shows the sector is still up roughly 57% from its spring low.
A 4% down day is the kind of day that makes people ask whether the AI trade is over. We do not think so. When yields fall and the Fed buys itself time, long-duration assets get relief, and technology earnings sit further out in the future than almost anything else in the index. A deep pullback in the leaders while the index holds up is also a better entry than a straight line up. We would rather look at that chart now than after semiconductors have already gone back to their highs.
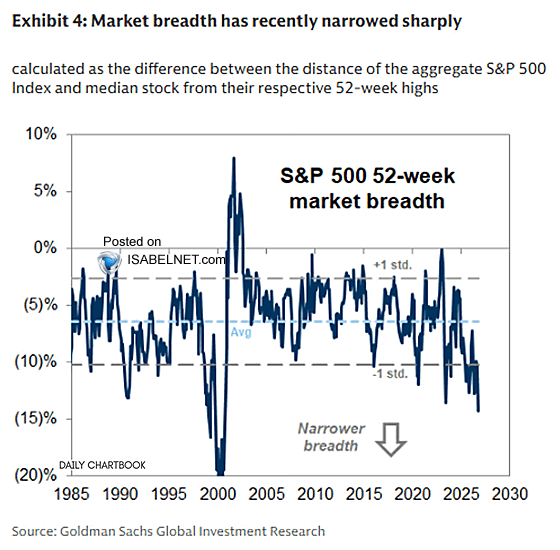
Here is the part of the picture that bothers us, so we will say it plainly. Goldman Sachs tracks the difference between how far the S&P 500 is from its 52-week high and how far the median stock is from its own. That gap is now roughly 14 points. The long-run average is somewhere near 6 or 7. The last time the gap was this wide was during the dot-com years.
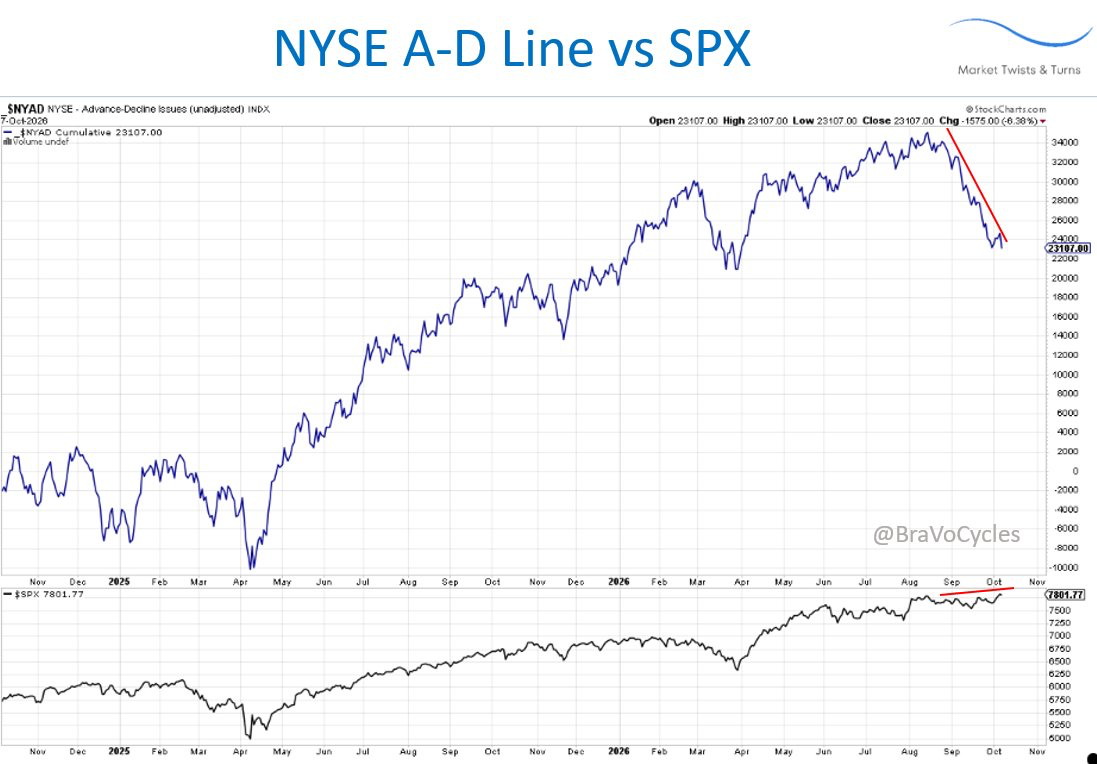
The second chart tells the same story another way. The advance-decline line adds up, day after day, the number of NYSE stocks that went up minus the number that went down. It peaked near 35,000 in August and has since dropped to 23,107, while the S&P 500 stayed close to its high. In plain English, fewer and fewer stocks are carrying the index.
It looks like a Mumbai locality where one new luxury tower lifts the average price per square foot, while most of the older buildings around it are selling for less. The average looks great. The neighbourhood does not.
We take the comparison with 2000 seriously, because narrow markets can end badly, and it is the reason section VI exists. But a thin market can resolve two ways. Either the leaders fall to meet the laggards, or the laggards catch up. With yields falling and the Fed waiting, we think the odds favour the second path. We also do not need breadth to heal for our call to work. We need the leaders to lead again.
We wrote about the midterm pattern in Memo #003, and it is worth looking at again because we are now inside it. The midterm election is on November 3. Kenneth Fisher's table tracks S&P 500 total returns for every midterm cycle since 1926. The gold box shows the stretch that matters: the fourth quarter of the midterm year, followed by the first two quarters of the president's third year.
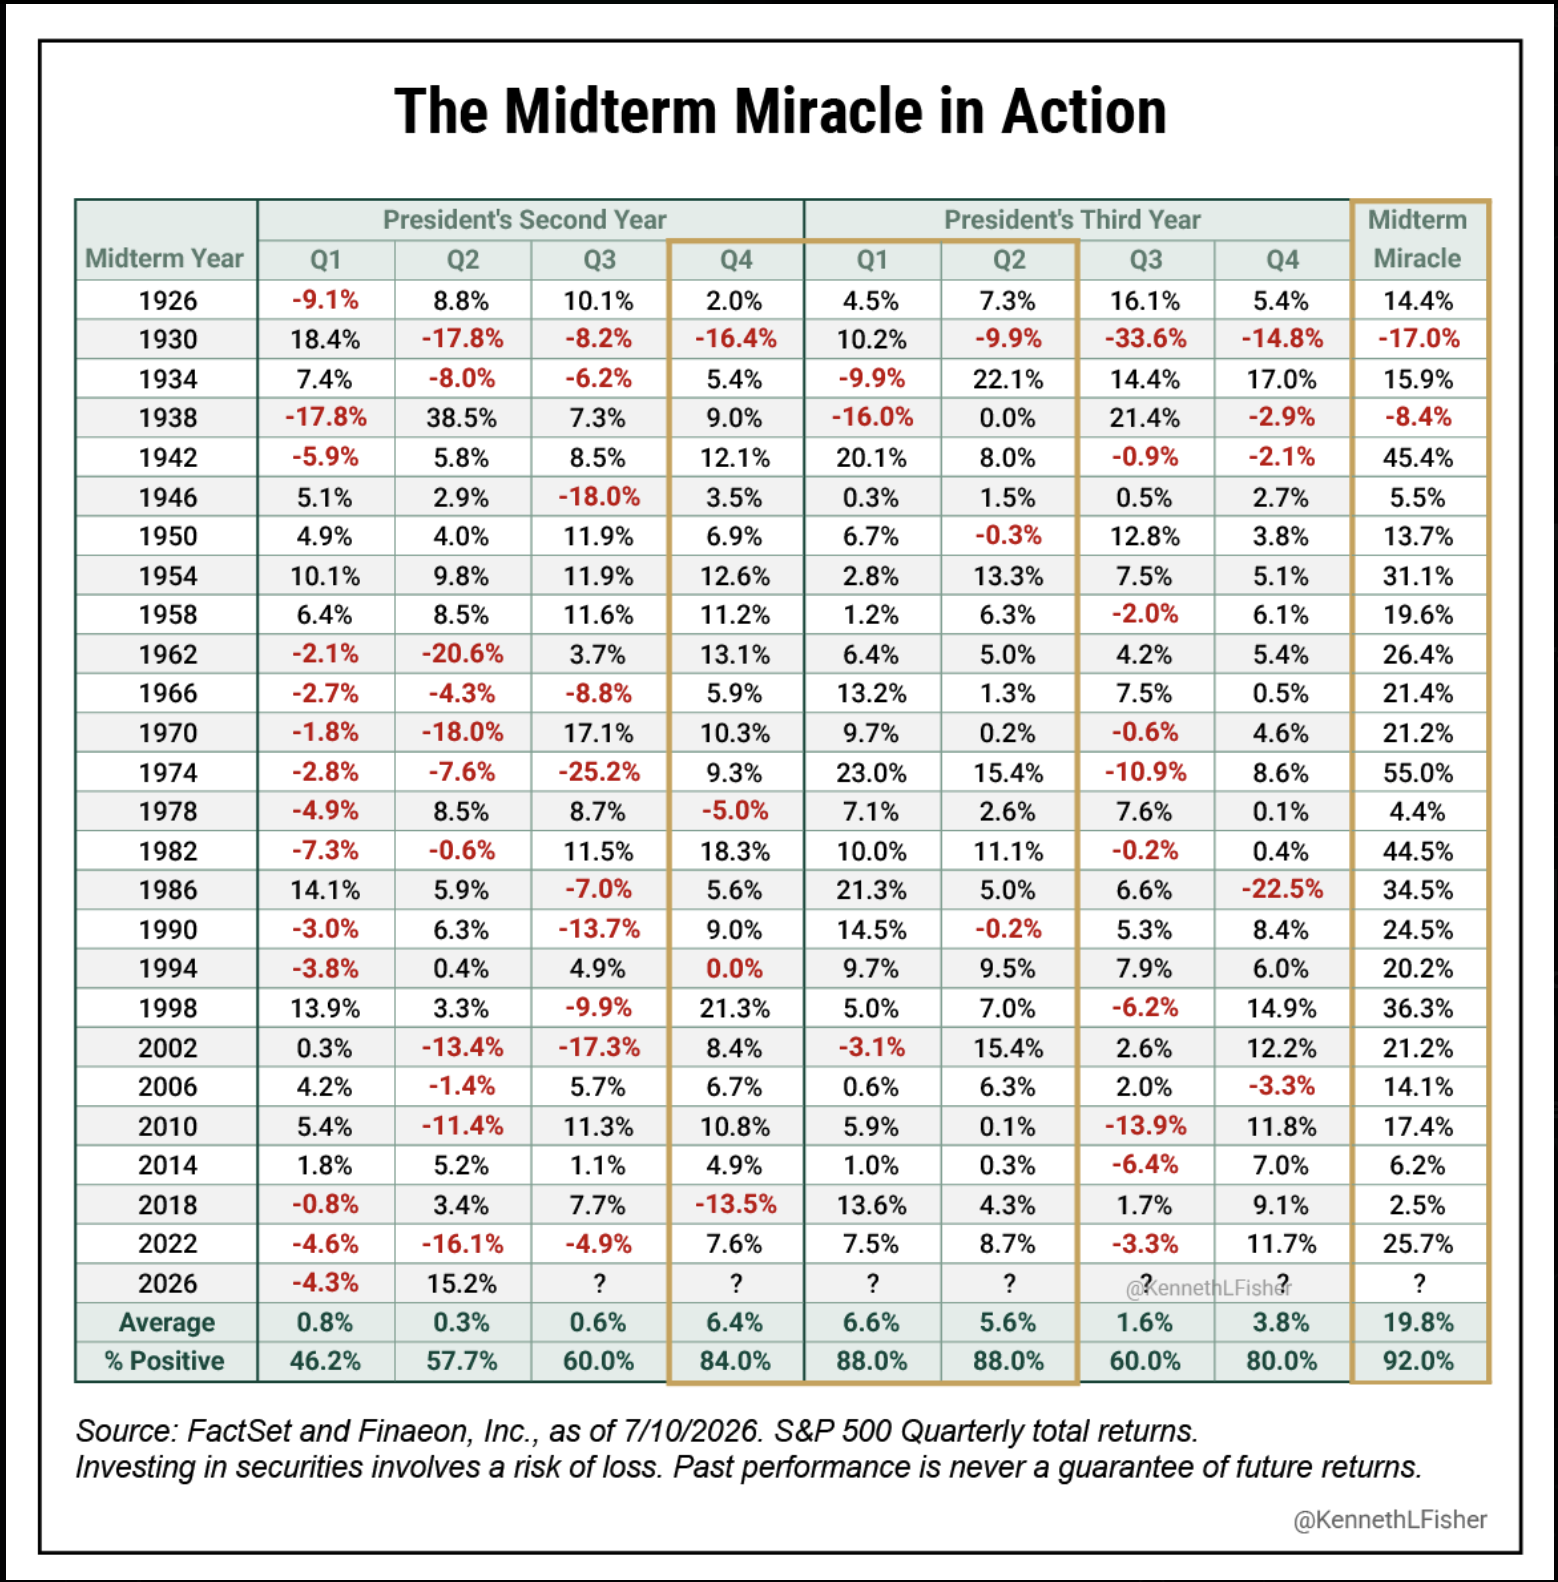
The fourth quarter of a midterm year has averaged 6.4% and been positive 84% of the time. The next two quarters have averaged 6.6% and 5.6%, each positive 88% of the time. Add the three together and the average gain is 19.8%, with a positive result in 92% of cycles. Out of 25 midterm years, only 1930 and 1938 finished that window in the red.
That does not mean the road is smooth. In 2018 the window opened with a 13.5% loss in the fourth quarter, and the three quarters still finished up 2.5%. Drawdowns inside the window are normal. It is where the window ends that has usually been positive. One more point of honesty about the table: it was published on July 10, so the third quarter of 2026 still shows a question mark. Through the second quarter, this midterm year had a 4.3% loss in the first quarter and a 15.2% gain in the second.
Twenty-five cases is a small sample, and past performance does not guarantee anything. We treat this as a base rate, not a forecast. But a base rate this lopsided, arriving just as the Fed pushes its hike out to December, is worth leaning on.
Our call is bullish on technology and semiconductors over the next two to three quarters. Here is how it could fail. Start with valuation. The S&P 500's trailing earnings yield, which is earnings divided by price, now sits 1.6 points below the 10-year Treasury yield. Over 1950 to 2026 the average gap has been a positive 1.0.
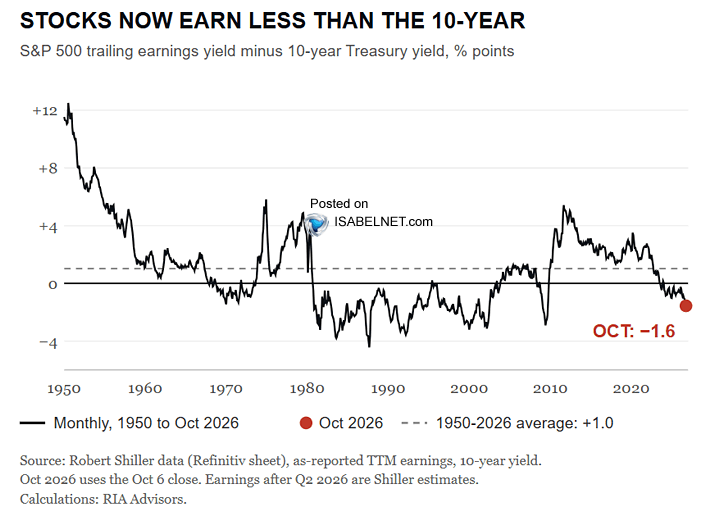
Put in property terms, it is like buying an apartment with a 3.5% rental yield when a government bond pays 5.1%. You are paying up for growth. That is a headwind, and we will not pretend otherwise. It is not a timing tool, though. The same chart shows the gap spent a good part of 1980 to 2008 below zero while stocks kept compounding.
So the more useful question is what would change our mind, and we can name four things. The first is a close above the 10-year's recent high of 5.365%, which would tell us the bond market has stopped looking through bad inflation news. The second is a hike or a hawkish surprise at the October 28 meeting. The third is the funding worry behind Wednesday's chip selloff. If credit markets start to shut the door on the AI buildout, the thesis breaks. The fourth is breadth continuing to deteriorate the way it did in 2000.
We are watching all four. Bad news that cannot lift yields has stopped being bad news in the way that matters. We would rather own the sectors that benefit when the market notices.
Disclosure: This memo reflects our sector-level view on technology and semiconductors. We do not name a specific security or fund in this memo. Double Eleven Capital & Co. and its partners may hold positions in companies within these sectors as of October 15, 2026.